In every business, managers need accurate information to make good decisions. Whether it is a small company or a large organization, decisions related to sales, operations, finance, and performance depend on reliable business data.
Traditionally, businesses relied on manual reports and spreadsheets to understand their performance. Employees would collect data from different departments, prepare reports, and send them to managers. This process often took hours or even days.
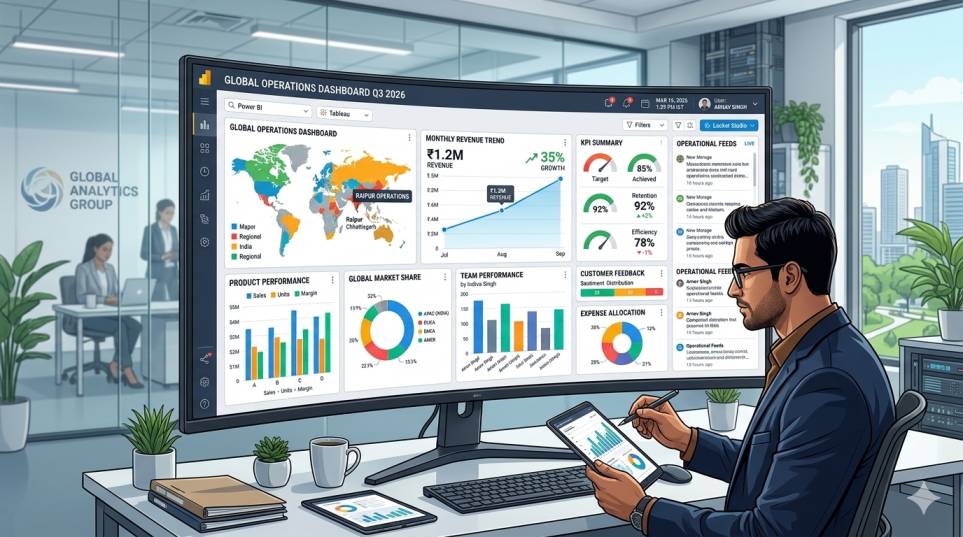
Today, modern organizations are moving toward MIS dashboards. These dashboards present business data visually using charts, graphs, and performance indicators so that managers can quickly understand what is happening in the organization.
In this article, we will explore what MIS dashboards are, how they work, and how they help managers make faster and better business decisions.
What is an MIS Dashboard?
An MIS Dashboard (Management Information System Dashboard) is a visual interface that displays important business information in one place.
Instead of reading long reports or multiple spreadsheets, managers can see key data through:
- charts
- graphs
- performance indicators
- summary tables
MIS dashboards usually display real-time or regularly updated business data so that decision-makers always have access to the latest information.
Many companies build dashboards using tools like Microsoft Power BI or other business intelligence platforms.
Why Businesses Need MIS Dashboards
Businesses generate large amounts of data every day.
Examples include:
- sales transactions
- customer information
- inventory records
- employee performance
- financial reports
Without proper systems, this data remains scattered across spreadsheets, software systems, or departments.
MIS dashboards help organize this data and present it in a clear format so managers can quickly understand business performance.
Problems with Traditional Reporting
Before dashboards became common, businesses relied heavily on manual reporting.
This approach created several challenges.
1. Time-Consuming Reports
Employees often spend hours preparing reports in spreadsheets before sending them to management.
By the time reports are ready, the information may already be outdated.
2. Data from Multiple Sources
Business data often comes from different systems such as:
- accounting software
- CRM systems
- inventory systems
- Excel files
Combining this data manually can be difficult and prone to mistakes.
3. Lack of Real-Time Information
Traditional reports are usually prepared daily, weekly, or monthly.
Managers do not always get immediate insights when problems occur.
4. Difficult to Understand
Large spreadsheets with hundreds of rows can be difficult to interpret.
Managers may struggle to quickly identify trends or issues.
How MIS Dashboards Solve These Problems
MIS dashboards simplify reporting and make business data easier to understand.
Here are some ways dashboards improve decision-making.
1. Visual Representation of Data
Dashboards present data using visual elements such as:
- bar charts
- line graphs
- pie charts
- KPI indicators
Visual data is easier for the human brain to understand compared to tables filled with numbers.
For example, a sales trend graph instantly shows whether sales are increasing or decreasing.
Read More: Excel vs Web Applications: Which is Better for Business Operations?
2. Real-Time Insights
Many MIS dashboards connect directly to business databases.
This means data updates automatically whenever new information is entered into the system.
Managers can monitor performance in real time instead of waiting for daily reports.
3. Faster Decision Making
When managers have instant access to accurate information, they can respond quickly to business situations.
For example:
If sales suddenly drop in a region, management can investigate immediately instead of discovering the problem at the end of the month.
4. Better Performance Monitoring
Dashboards allow managers to track important Key Performance Indicators (KPIs) such as:
- sales targets
- revenue growth
- operational efficiency
- customer acquisition
Tracking these metrics helps organizations stay focused on their goals.
5. Centralized Business Information
MIS dashboards bring data from different departments into one system.
Instead of checking multiple reports, managers can view everything on a single dashboard.
This provides a complete overview of business operations.
Examples of MIS Dashboards in Businesses
Different industries use dashboards in different ways.
Here are some common examples.
Sales Dashboard
A sales dashboard may include:
- daily sales performance
- top-selling products
- regional sales comparison
- monthly revenue trends
Managers can quickly see which products or regions perform best.
Read More: What is MIS Automation? A Practical Guide for Businesses
Financial Dashboard
A finance dashboard may track:
- revenue
- expenses
- profit margins
- budget performance
This helps finance teams monitor the company’s financial health.
Operations Dashboard
Operations dashboards monitor internal processes such as:
- order processing time
- inventory levels
- production performance
This allows managers to identify operational bottlenecks.
Customer Analytics Dashboard
These dashboards track customer-related metrics like:
- customer acquisition
- customer retention
- order frequency
- average order value
Understanding customer behavior helps businesses improve their marketing strategies.
Tools Used to Build MIS Dashboards
Several tools help businesses build powerful dashboards.
One of the most popular tools is Microsoft Power BI, which allows organizations to connect data sources, create visual reports, and share dashboards across teams.
Power BI helps businesses transform raw data into interactive visual insights that are easy to understand.
Other tools and technologies used in dashboard systems include:
- databases managed through SQL
- automated data processing using Python
- web-based reporting systems
These technologies work together to create powerful MIS reporting environments.
Benefits of MIS Dashboards for Managers
Managers rely on dashboards because they offer several practical benefits.
Clear Business Insights
Dashboards simplify complex data and present clear performance indicators.
Quick Problem Identification
Managers can quickly identify issues such as declining sales or operational delays.
Improved Planning
Historical trends displayed on dashboards help managers plan future strategies.
Data-Driven Decisions
Instead of relying on assumptions, managers make decisions based on real data.
Improved Communication
Dashboards allow teams to share the same data and insights, improving collaboration across departments.
Real Example: MIS Dashboard in a Retail Business
Consider a retail company with multiple branches.
Without dashboards, the company may rely on daily Excel reports from each branch.
Managers would need to combine these reports manually to understand performance.
With an MIS dashboard:
- sales data from all branches flows into one system
- the dashboard displays real-time performance
- managers can compare branch sales instantly
- top-performing products become visible immediately
This level of visibility helps the company respond quickly to changes in the market.
The Future of Business Reporting
As businesses generate more data, traditional reporting methods are becoming inefficient.
Organizations are increasingly adopting:
- automated reporting systems
- real-time dashboards
- data visualization tools
These technologies allow companies to operate faster and make smarter decisions.
MIS dashboards are becoming a core component of modern business intelligence systems.
Final Thoughts
MIS dashboards play a crucial role in modern business management. They transform complex data into clear visual insights that help managers understand business performance quickly.
Instead of relying on manual reports and spreadsheets, dashboards provide real-time information that supports faster and more informed decision-making.
By using tools such as Microsoft Power BI and integrating data from databases and automated systems, businesses can create powerful MIS dashboards that improve efficiency and operational visibility.
For organizations looking to become more data-driven, implementing MIS dashboards is an important step toward smarter business management.
FAQs – MIS Dashboards
How do dashboards help in decision making?
They show real-time insights, helping managers take quick decisions
What type of data is shown in dashboards?
Sales, revenue, performance, pending tasks, etc.
Are dashboards useful for small businesses?
Yes, they help track performance and growth easily.
What tools are used to create dashboards?
Power BI, Tableau, and Looker Studio etc.